Fast Food Demand Forecasting with Uncertainty Quantification
My MSc thesis: order forecasts for 17 Vilnius restaurants with ARIMA, DeepAR and a TFT, then a test of whether their prediction intervals hold.

Problem
Restaurants run on thin margins, and getting demand wrong hurts both ways: underestimate and you get stockouts and long waits, overestimate and you get food waste and idle staff. A genuinely useful forecast has to say not just how many orders to expect, but how confident it is in that number. This was my MSc thesis at Kaunas University of Technology, supervised by Doc. dr. Tomas Iešmantas.
The target is the number of unique orders per venue per period (daily and hourly) across 17 restaurants in Vilnius, which tracks kitchen workload and staffing far better than total sales value does.
Approach
The pipeline runs end to end on roughly 12.9 million POS records from May 2023 to October 2024, enriched with weather and holiday data:
- Clean and aggregate the raw POS data onto a regular, zero-filled daily and hourly grid per venue.
- Engineer features: calendar effects, demand lags (7 and 14 days), rolling mean and standard deviation, temperature and rain, a holiday flag, and per-venue static statistics.
- Fit and compare four models: a naive rolling baseline, ARIMA(1,1,1) with walk-forward refitting, DeepAR (a 4-layer LSTM with a Gaussian likelihood), and a Temporal Fusion Transformer doing quantile regression over seven quantiles. DeepAR and TFT are global panel models built with
pytorch-forecasting. - Score both point accuracy (MAE, RMSE, SMAPE, MAPE) and uncertainty (interval coverage and hit rate at 50, 80 and 96%).
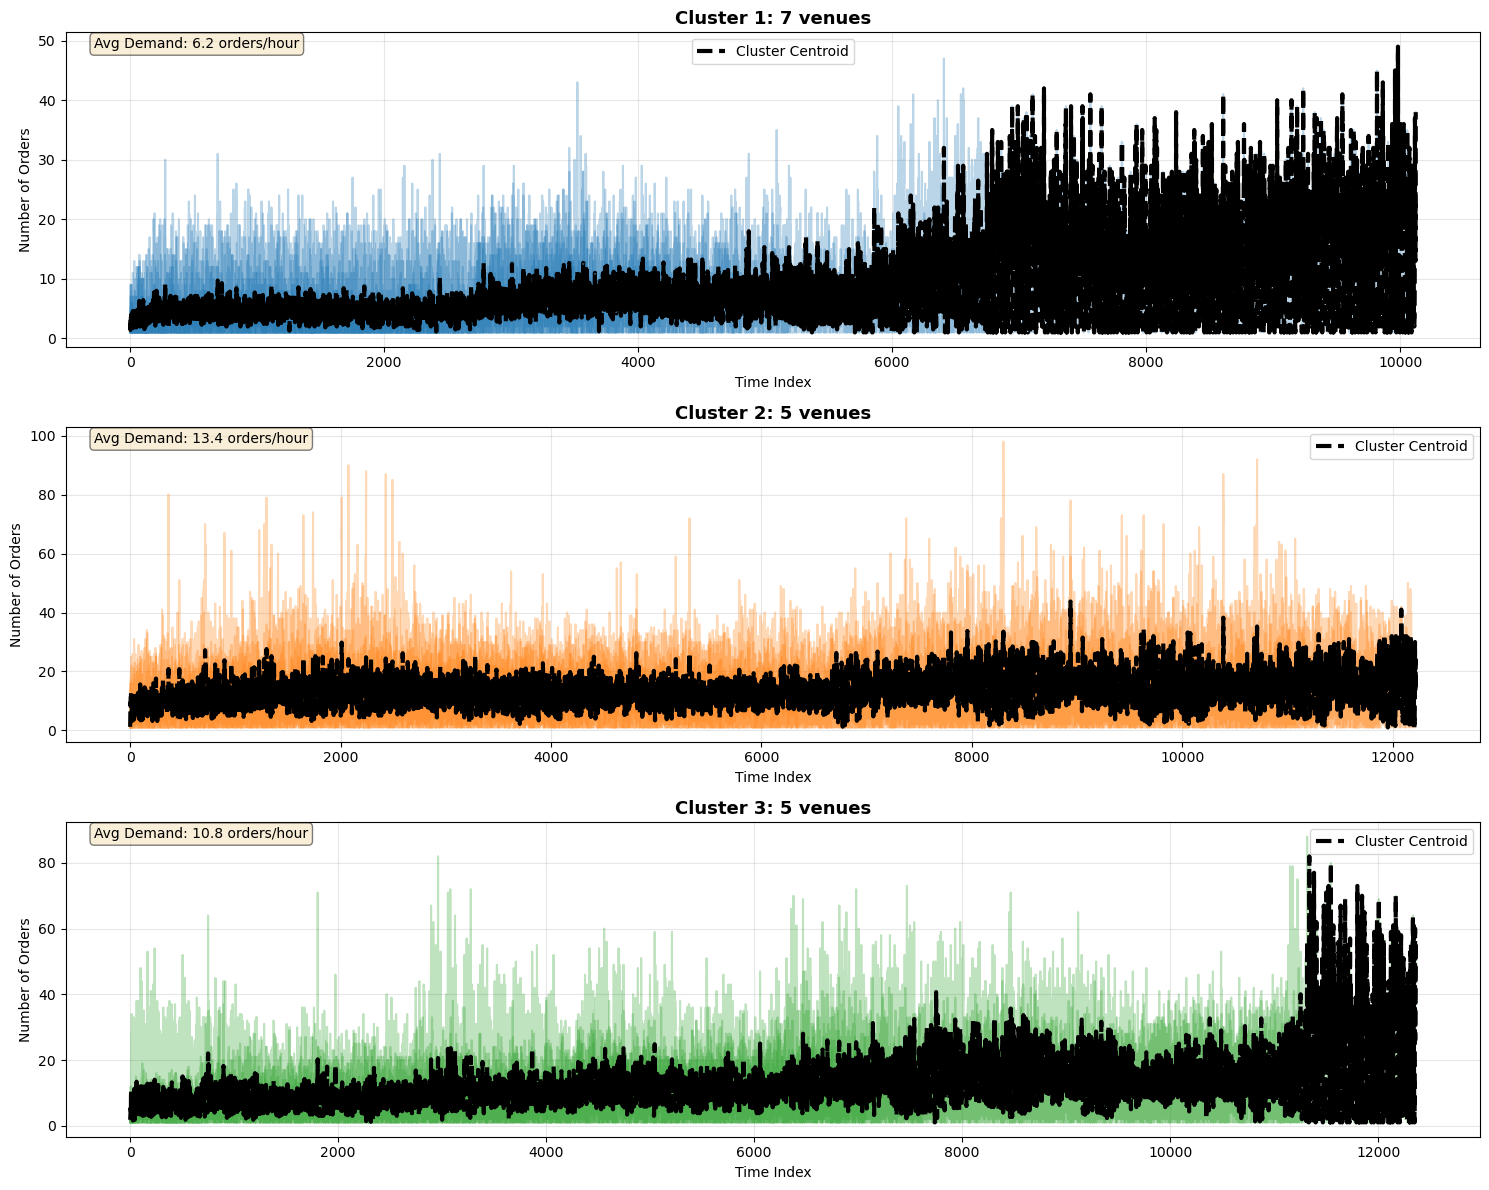
- Cluster venues with DTW-based
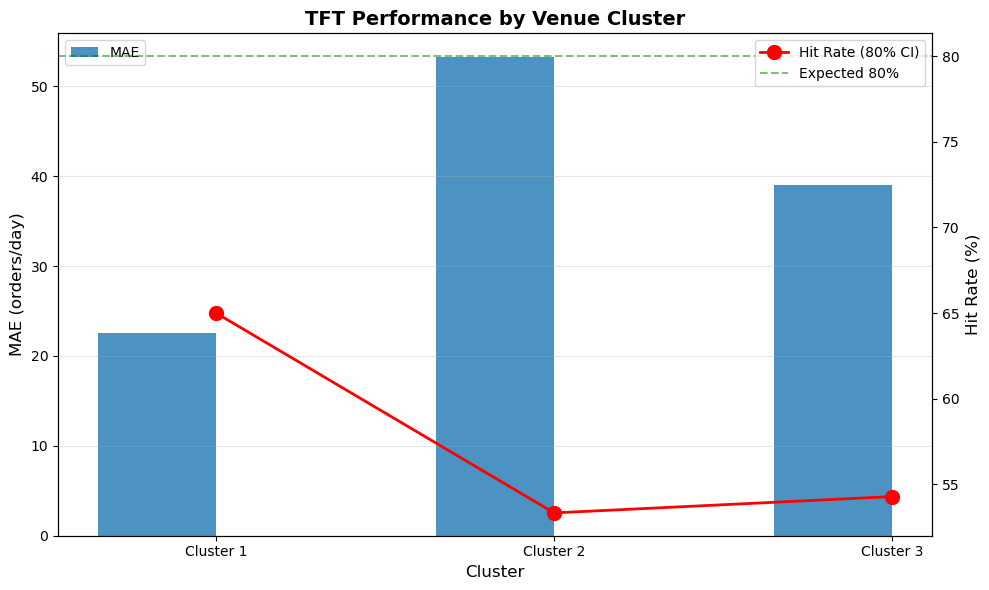
TimeSeriesKMeansand analyze per-cluster error, Lorenz curves and permutation feature importance.
Results
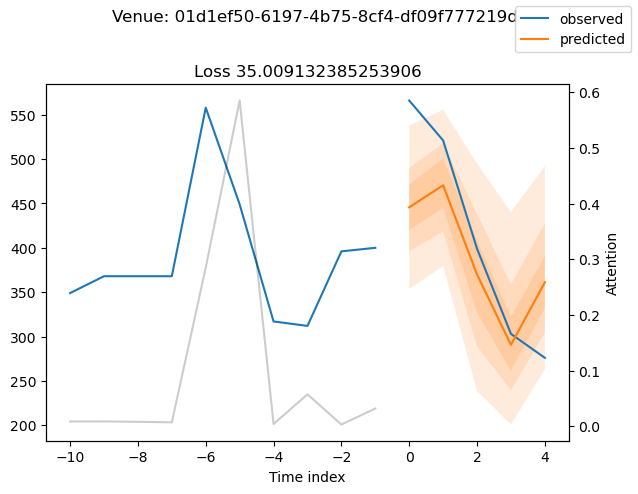
- The Temporal Fusion Transformer was best on daily demand (MAE 37.3, MAPE 15.5%), beating ARIMA and DeepAR. DeepAR’s autoregressive structure won on the hourly horizon.
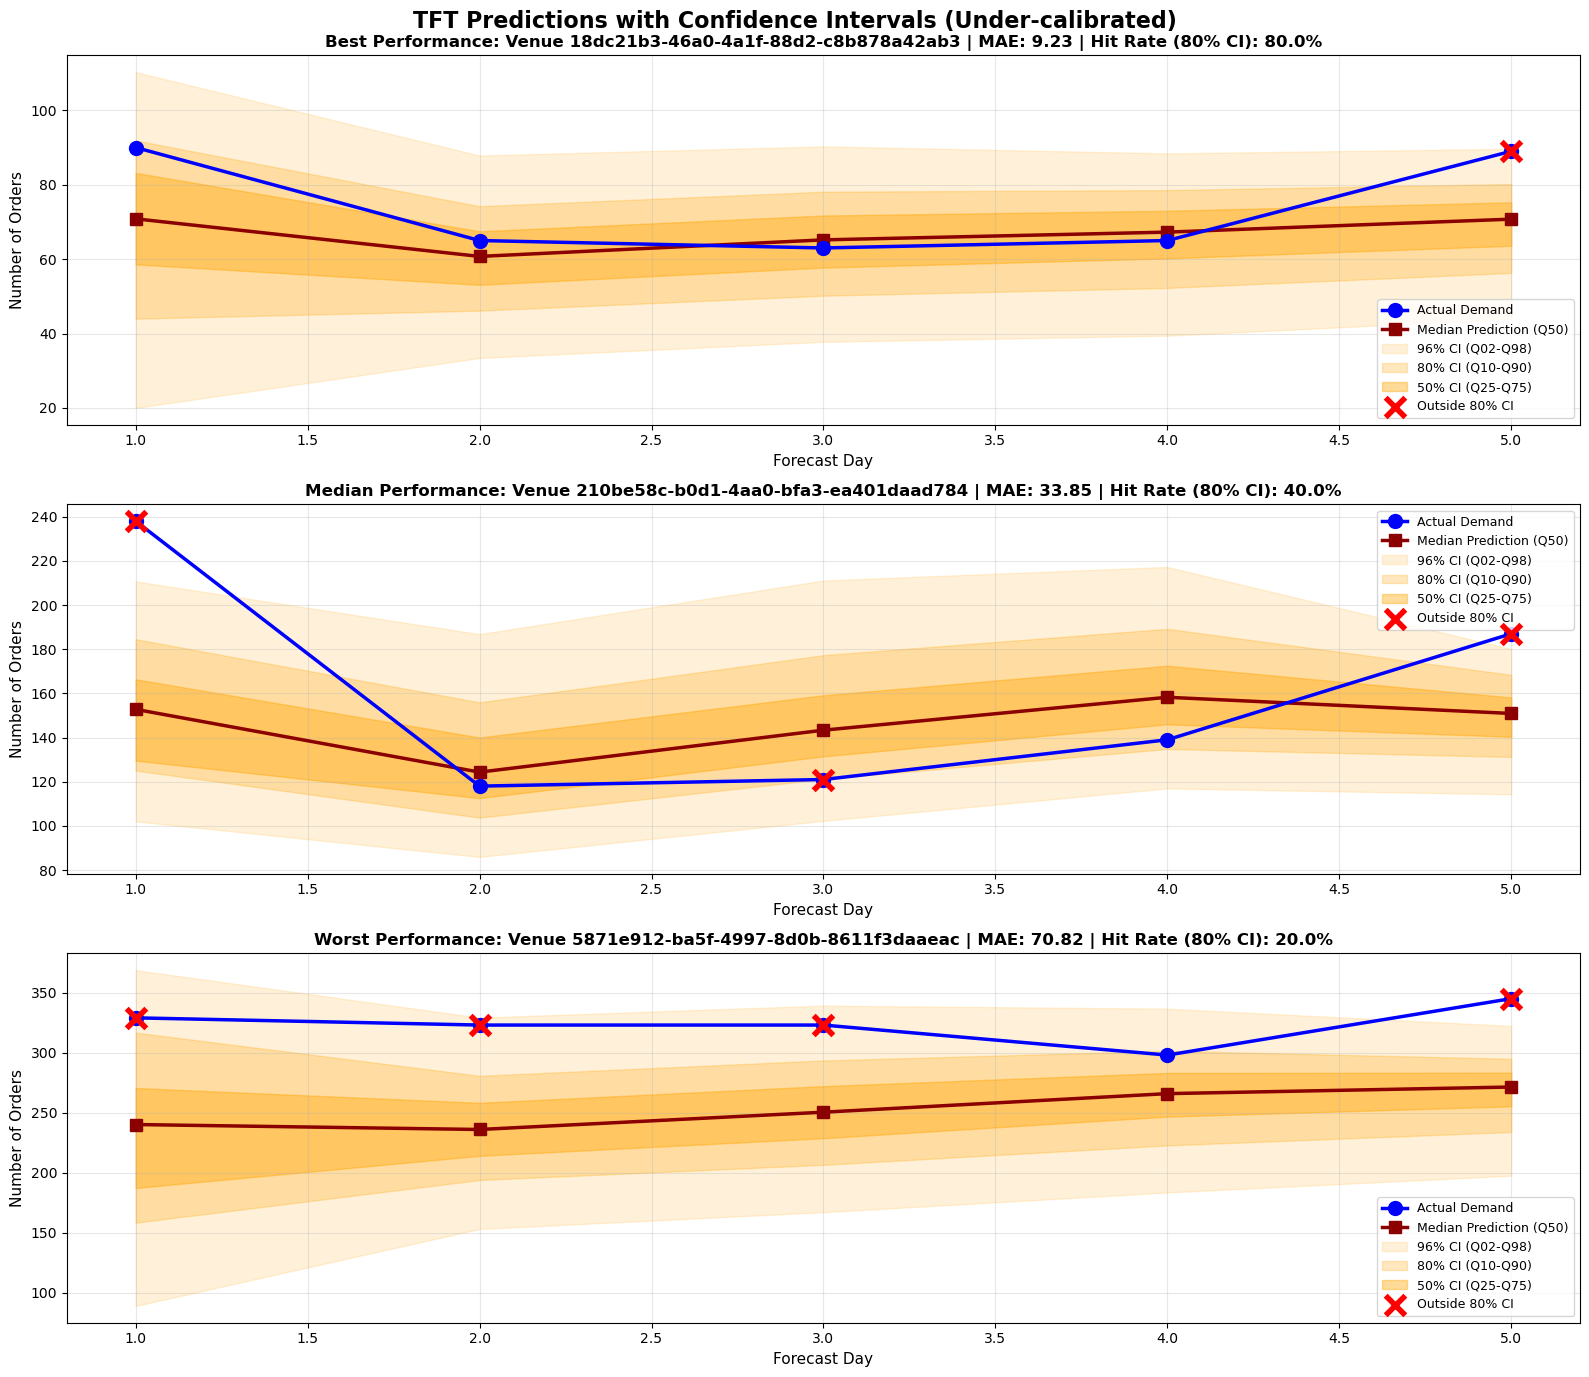
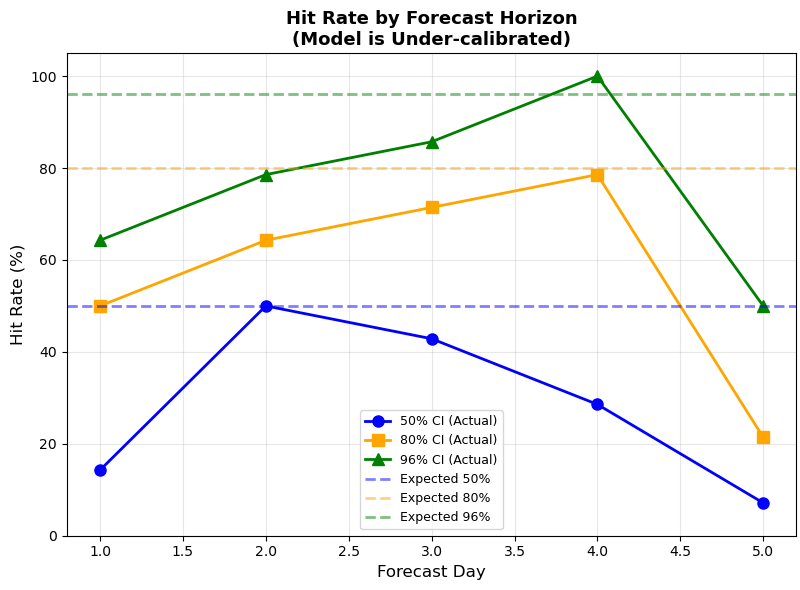
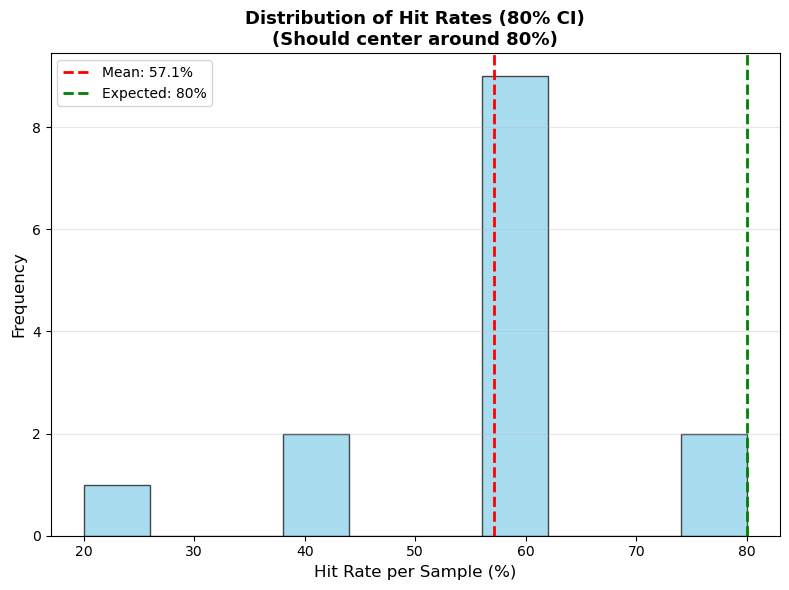
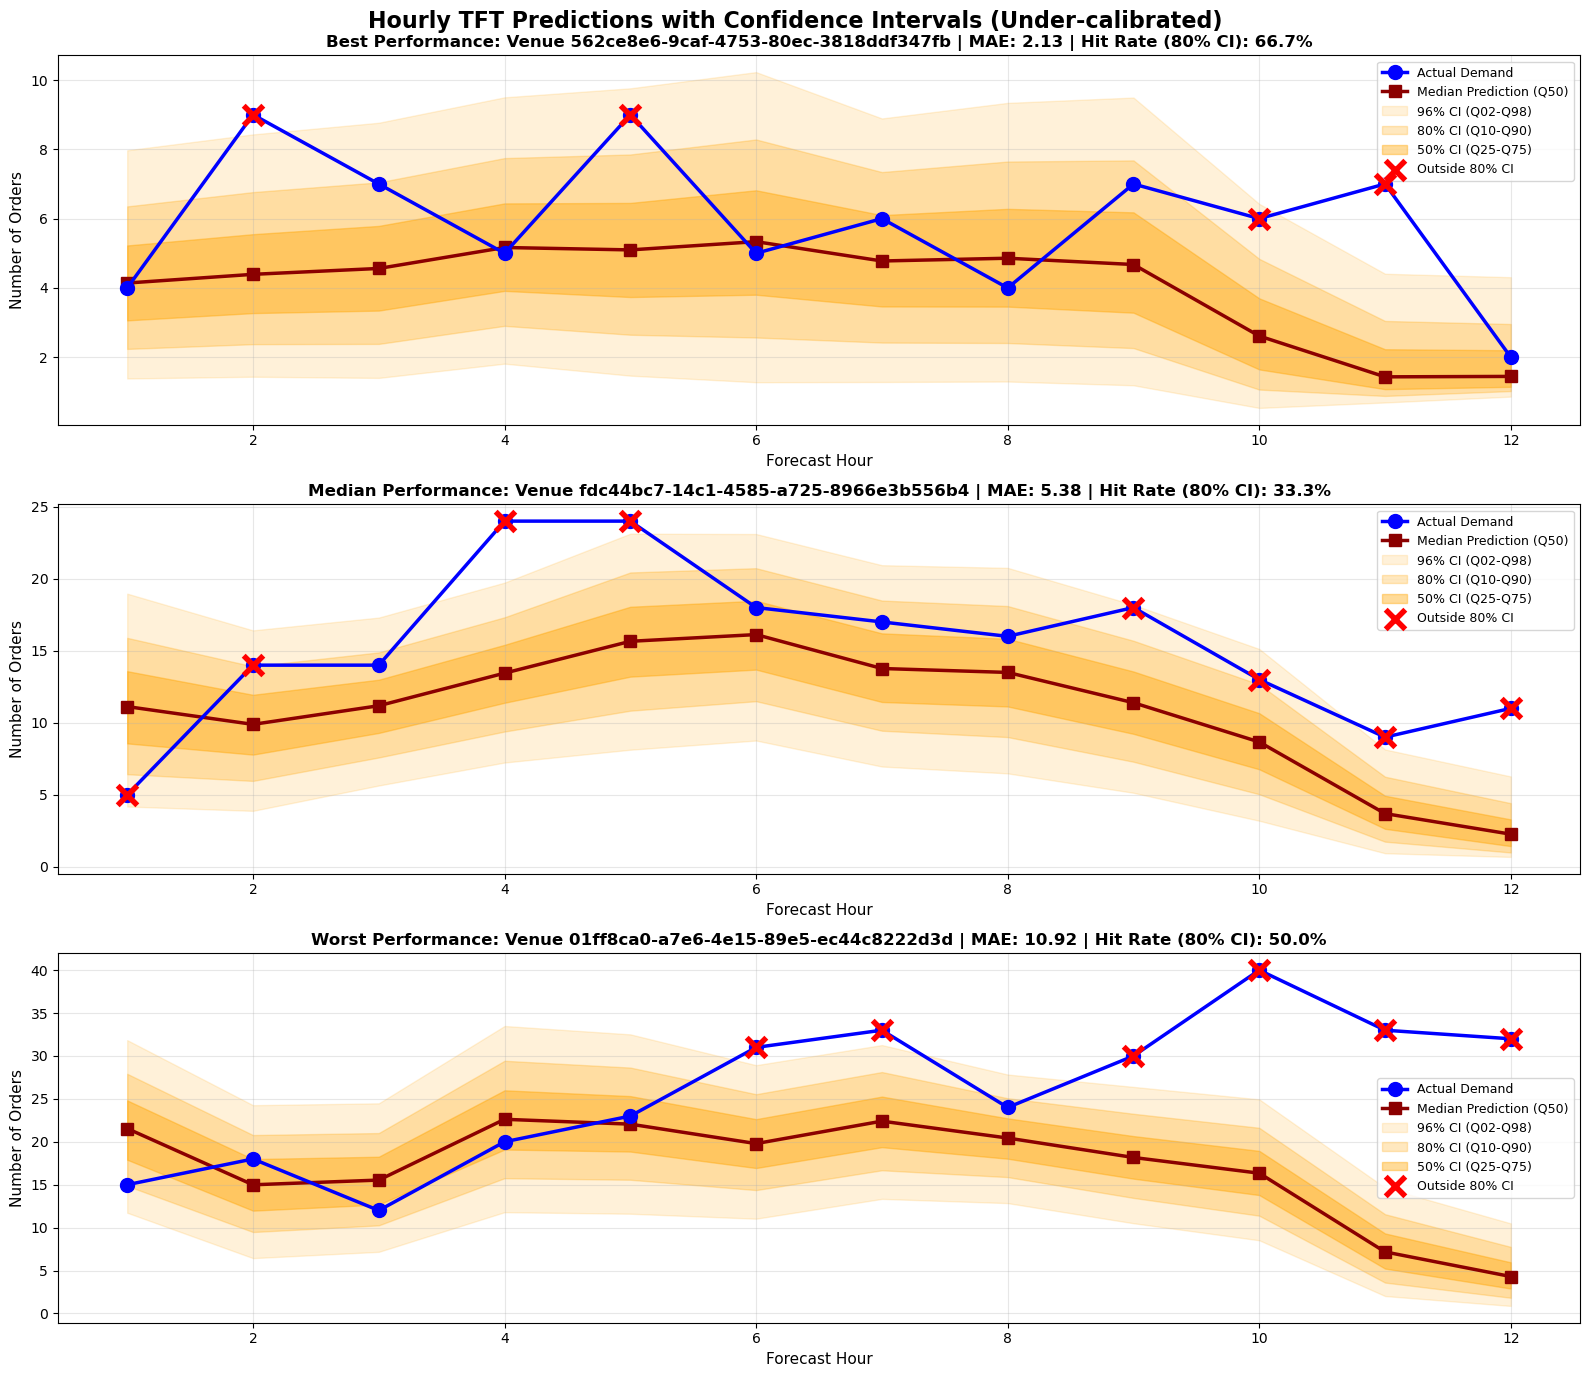
- The headline finding was about calibration, not accuracy: the prediction intervals were systematically too narrow. TFT’s nominal 80% daily intervals only covered about 57% of actual values, so the models were overconfident, especially around demand peaks.
- 50% interval28.6% of 50%
- 80% interval57.1% of 80%
- 96% interval75.7% of 96%


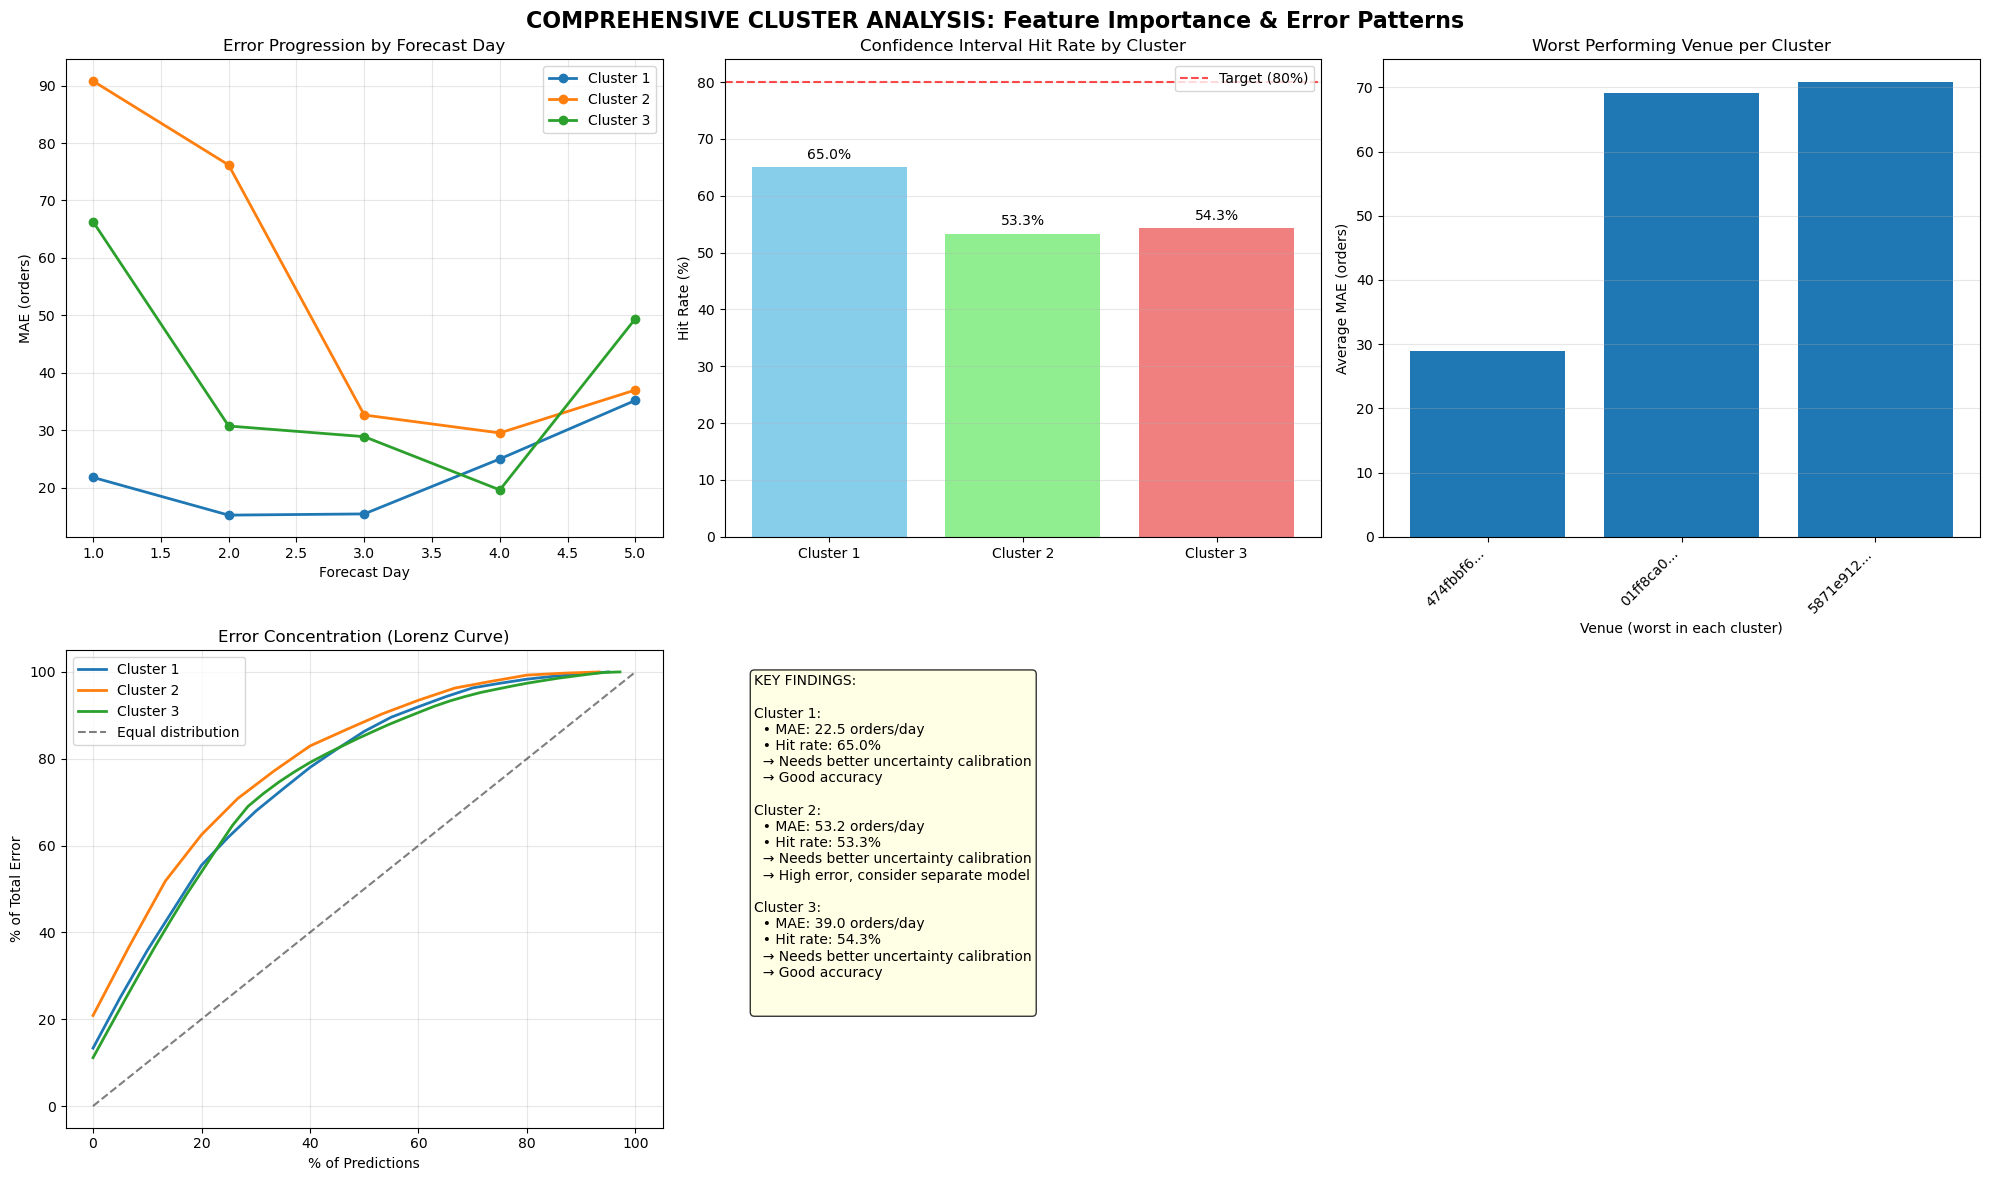
- Error was highly concentrated. A few high-volume venues (300+ orders a day) drove most of the total error, which argues for supplementing global models with venue- or cluster-specific tuning.

- ARIMA held up as a strong, cheap daily baseline and even beat DeepAR on daily data, which keeps it attractive when simplicity or compute budget matters.
The full thesis and defense slides are in the repository’s docs/ folder.
Figures




Correspondence
Research, data science work or a question about a project. Email, LinkedIn or the contact form all reach me.
There is also a contact form, and aresume (PDF).